It starts with what is actually happening
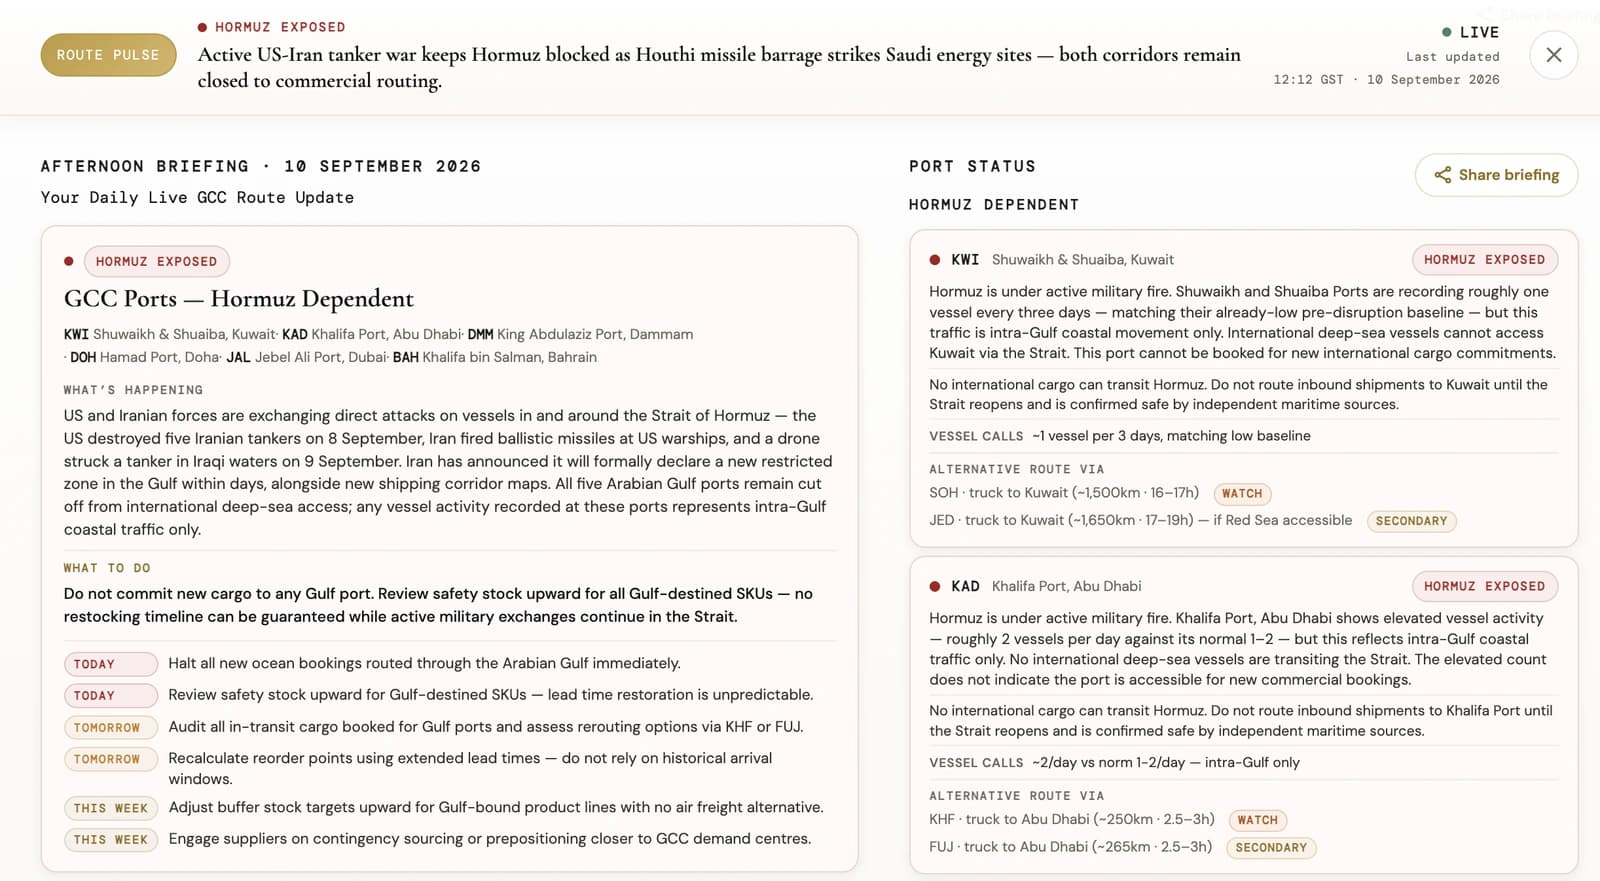
Route Pulse is a live read on GCC ports, corridors and chokepoints, rebuilt four times a day. It answers the first question a planner has when a corridor closes: which ports can still take my cargo, and what is the way in.
Every port carries its own status, the vessel traffic behind that status, and the alternative route with its sea days and land leg. Where a lane is blocked, it says so plainly and names what to do today, tomorrow and this week — because “the Strait is closed” is not an instruction.
It is free to read and needs no account.
Then it tells you what that does to your stock
Most reorder calculations assume a lead time that does not move. When a corridor closes, planners update the average and stop there.
Disruption does not just make lead times longer. It makes them less predictable.
That distinction decides how much safety stock you actually need. A lane whose transit has stretched but stayed consistent needs a different buffer to one that has become erratic, even where the average is identical. The Calculator carriesboth — it reads the same live route intelligence behind Route Pulse, including current chokepoint status, and applies a validated disruption extension to the lead time you enter, then works the buffer from the resulting spread.
Check a route free
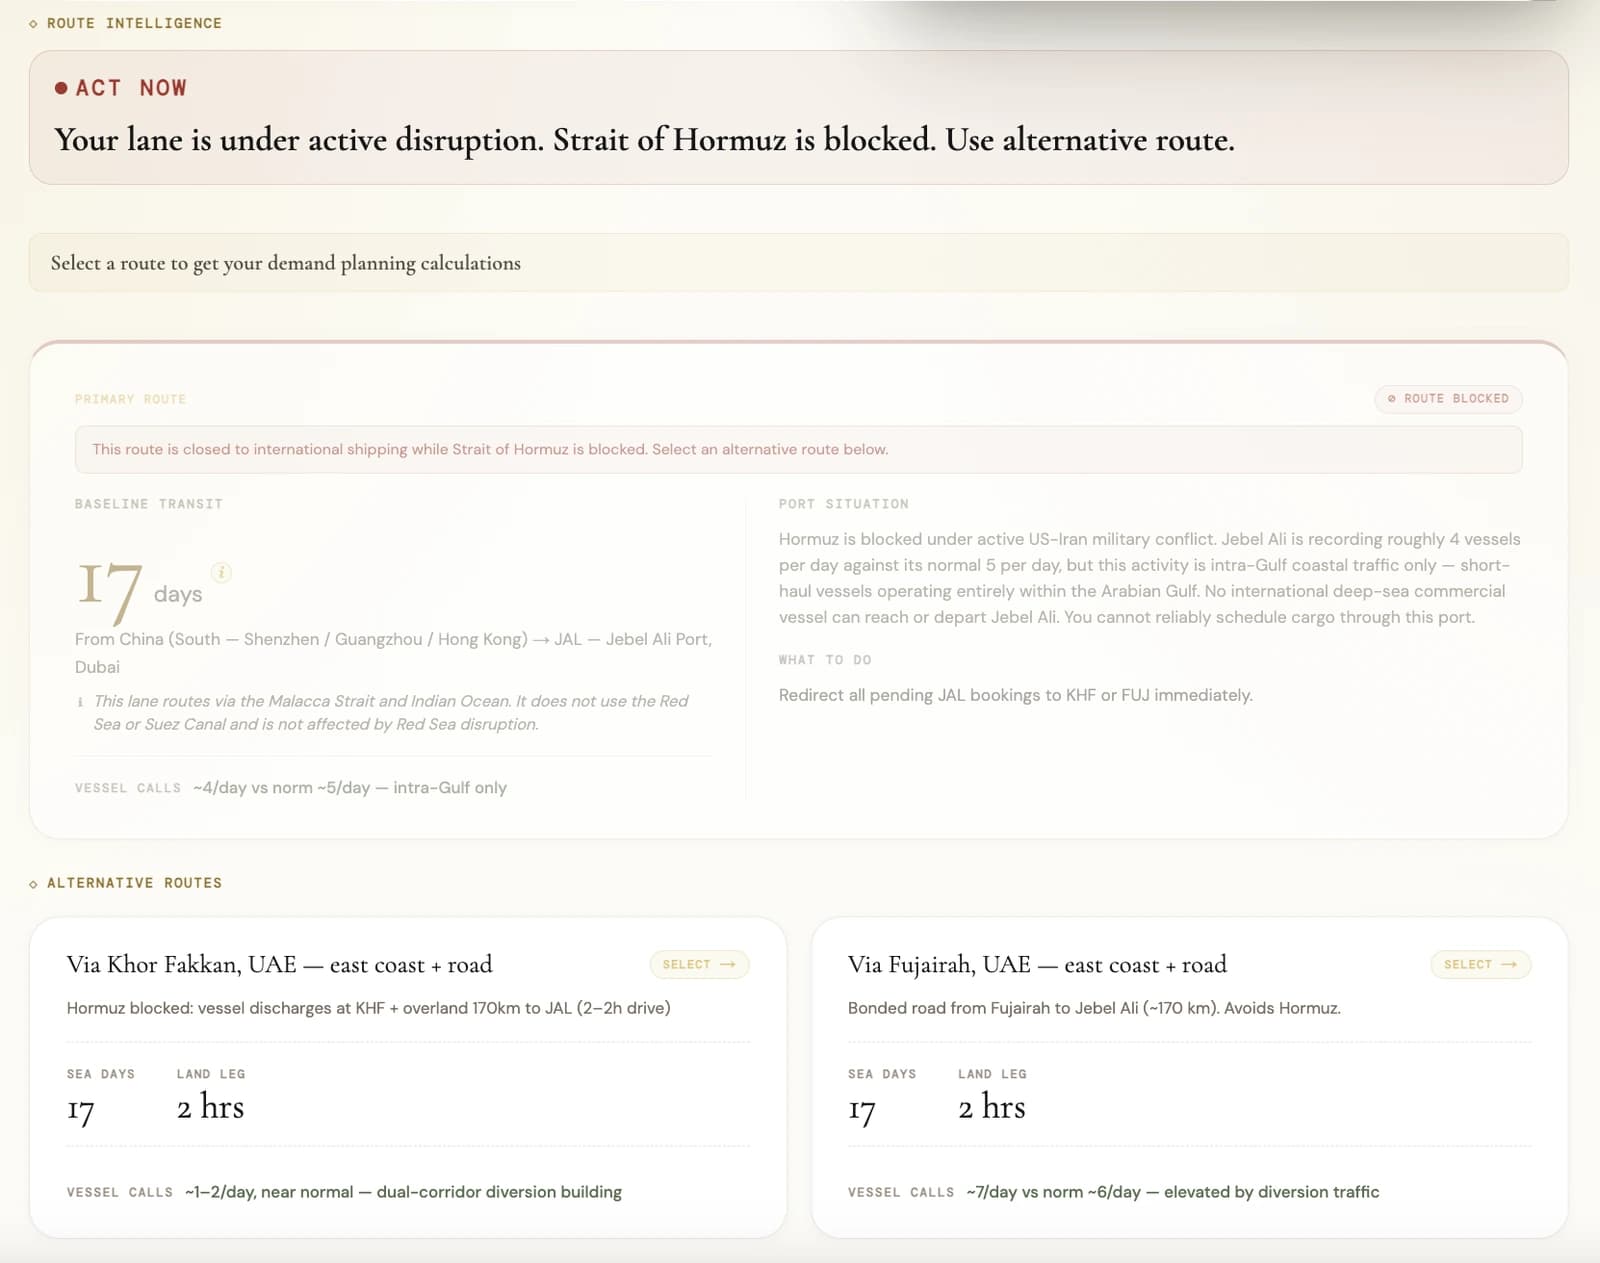
Pick an origin country and a GCC destination port. You get the baseline transit time, whether the lane is currently disrupted, and the alternative routes with their own transit times. A free account is all it takes — no subscription, no card.
The full calculation
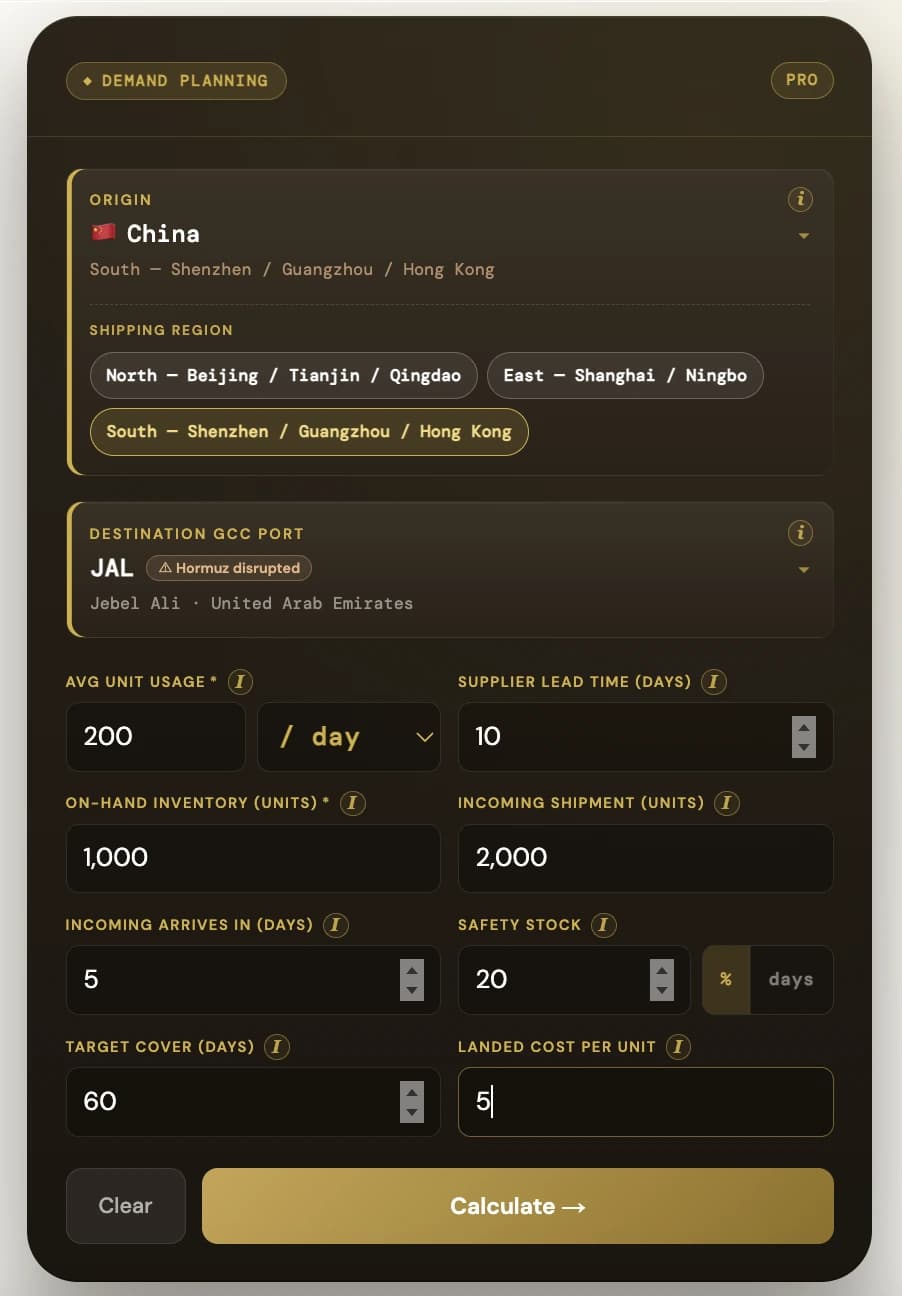
Add your demand and inventory position — usage, supplier lead time, on-hand, incoming shipment and its arrival, buffer policy and target cover — and the Calculator returns:
- Effective lead time. A range, not a single number — origin haulage, port dwell, sea transit, clearance and goods receipt, with the current disruption extension applied.
- Safety stock. Your buffer policy converted into units against the disruption-adjusted lead time, shown as a range.
- Order quantity. How many units to order now.
- Reorder point. The stock level at which the next order has to be placed.
- Days of cover. How long on-hand plus incoming lasts at current demand.
- Urgency signal. Order now, order in X days, or you are covered — with the date.
- Gap alert. Flags the stockout window: how many days and how many units are exposed before your next arrival closes the gap.
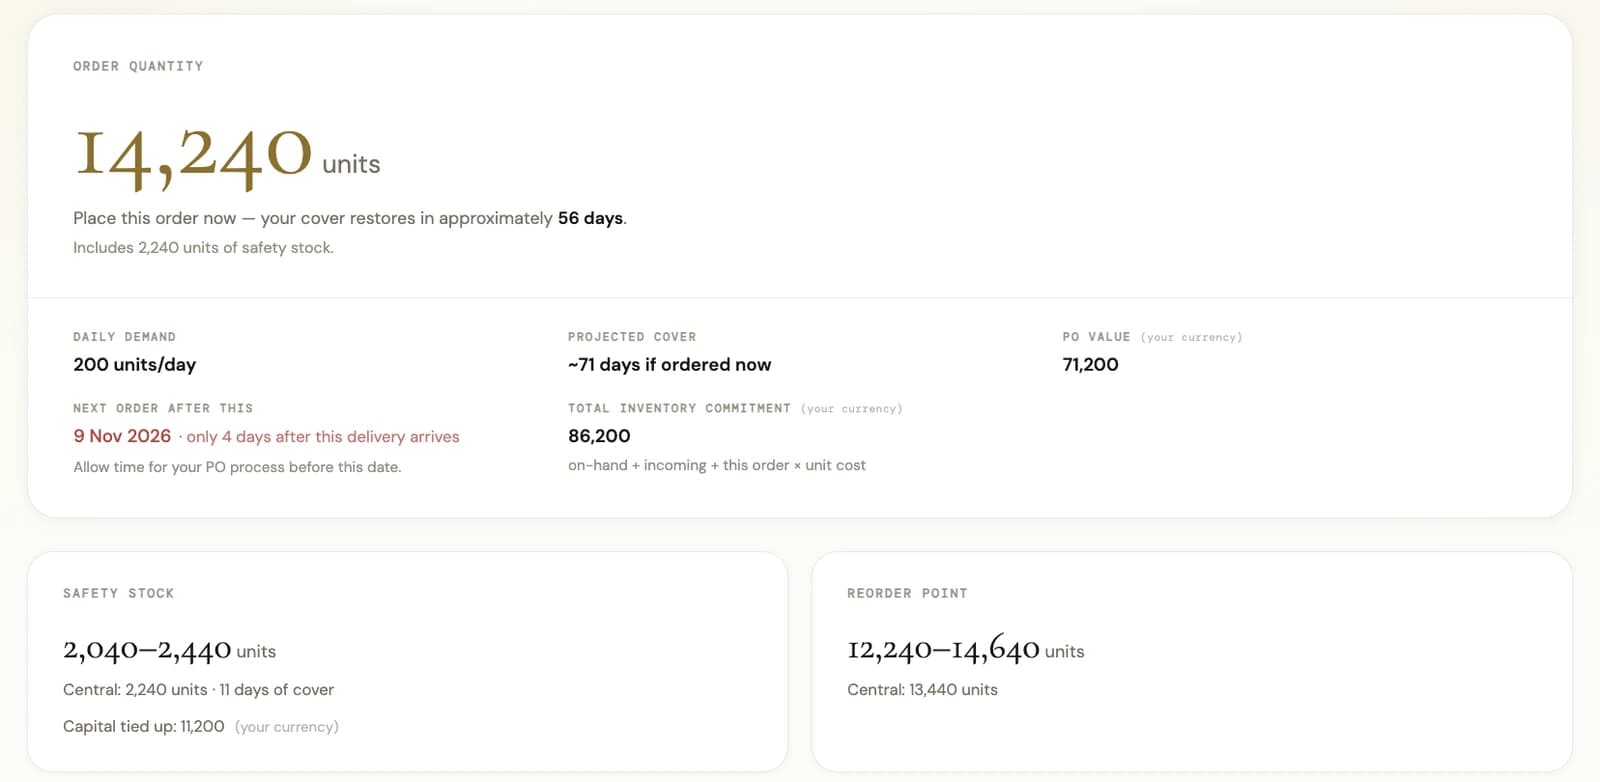
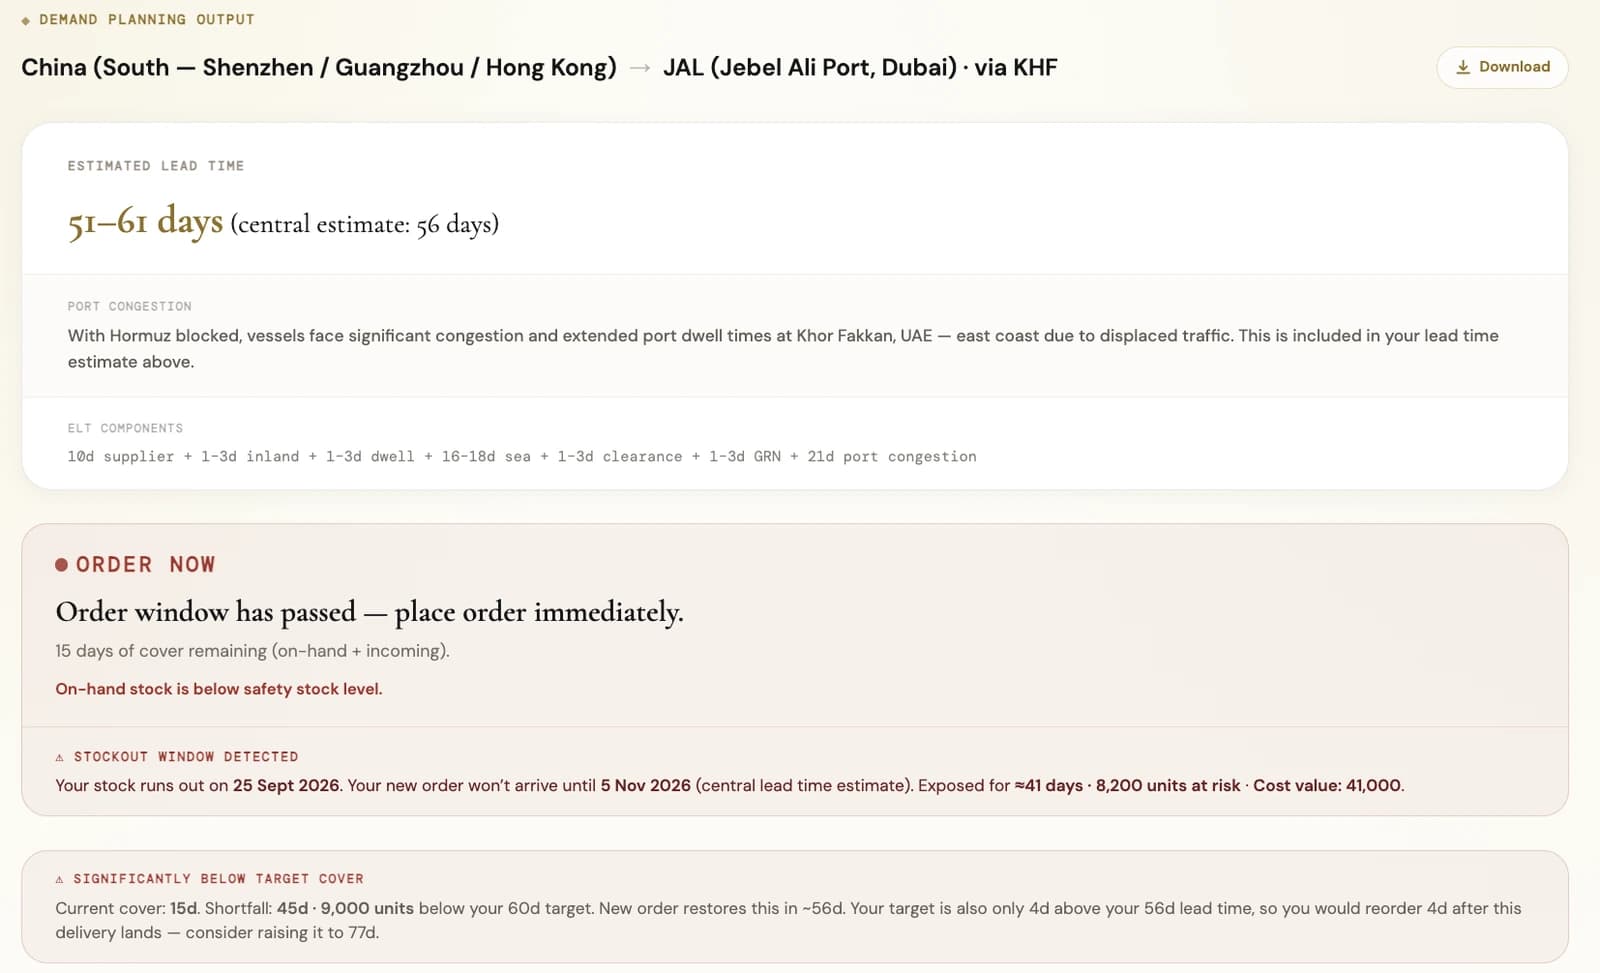
Enter a landed cost per unit and the same results carry their financial consequence: what the order commits in cash, what the buffer ties up permanently, and what is exposed if a gap is not closed.
Built for people without an enterprise planning system
Multi-echelon inventory optimisation exists inside SAP IBP and Kinaxis. Most mid-market GCC distributors are not running either — they are running a spreadsheet, or an ERP whose safety stock field takes a fixed number of days. This is for them.
Honest about what it does not know
Lead times are shown as ranges rather than false precision, every result states the assumptions that drove it, and the underlying route data carries its own timestamp and source. It is decision support, not a guarantee — the same caveat we would give in a room.